The US S&P500 was up again over the week, rising by 0.4% (and is up by 12% since January) and the tech-heavy NASDAQ was 0.1% higher and this also follows a massive rally over recent weeks (with the NASDAQ up by 27% since the beginning of the year). Australian shares were down 0.3% over the week and are only up by 1.1% over the year, underperforming the US because of weakness in financials and energy (which have a larger weighing in our sharemarket relative to the US) and lower weighting of tech shares. Eurozone shares were also down this week (-0.8%), Japanese shares rallied another 2.4% and are at their highest level since the early 1990’s and Chinese shares were flat despite reports of government-financed stimulus (including tax exemptions for electric vehicles to boost consumption, measures to support the property market and tax breaks for manufacturing companies). US yields were up slightly while the USD fell.
There are still a lot of negatives that could weigh on shares in the near-term: markets may need to adjust to the idea that central banks aren’t done with raising interest rates (as we saw this week with “surprises” from the Bank of Canada and the Reserve Bank of Australia), a build-up in the Treasury General Account which will be negative for liquidity in markets, a pause in the tech trade which has lifted US sharemarkets recently and the background of continued recession risks. With shares up by over 20% since the October low (which would technically be a “bull” market), if sharemarkets can rally through these risks in the near-term then perhaps a bull market rally is more sustainable.
Commodity prices were mixed, with iron ore up (on Chinese stimulus expectations), oil prices were down to just over $70/barrel despite announcements of production cuts from Saudi Arabia, metal prices like copper, gold and silver were up and agricultural prices like soybeans, sugar and wheat prices rose on supply concerns after the collapse of a major dam in Ukraine.
Economic activity trackers
Our Economic Activity Tracker was lower for the US this week and slightly up in both Australia and Europe, although our activity trackers have been on a clear downtrend across all regions in recent months which should mean slower growth GDP growth.
Based on weekly data for eg job ads, restaurant bookings, confidence, mobility, credit & debit card transactions, retail foot traffic, hotel bookings. Source: AMP
Our Pipeline Inflation Indicator continues to decline and has been a good leading indicator for consumer price data (see the chart below).
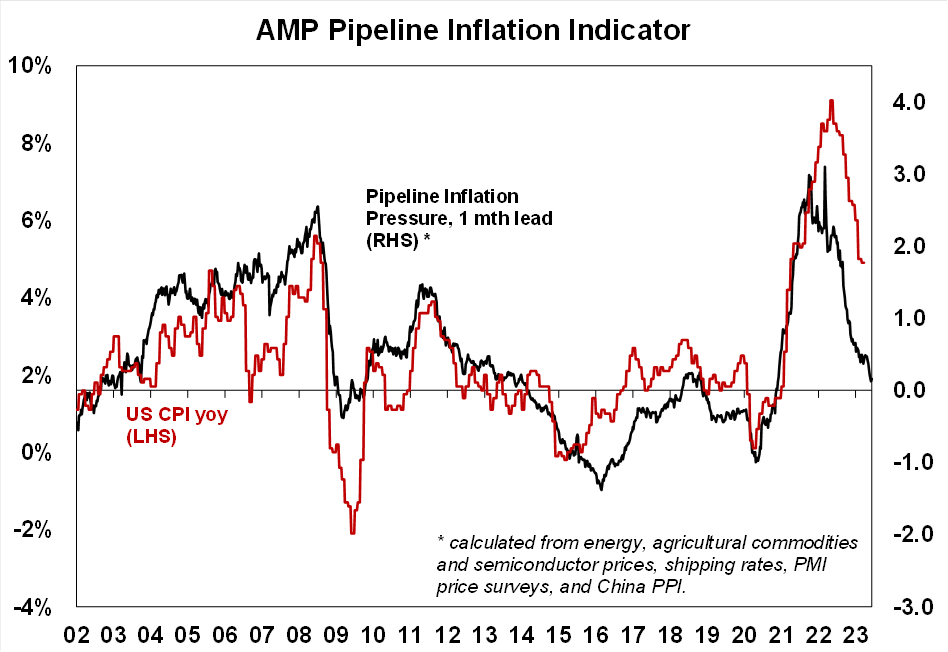
Source: Bloomberg, AMP
Major global economic events and implications
The US services ISM fell to a neutral level of 50.3 in May (from 51.9 last month) against expectations for a rise and is weaker than the signal sent from the PMI index (see the chart below) which could be a sign that services activity is declining.
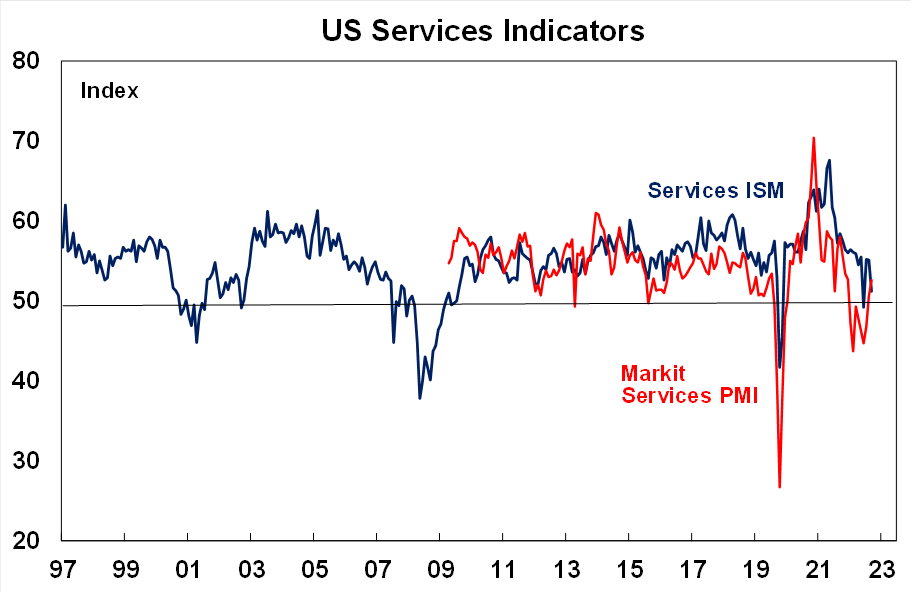
Source: Bloomberg, AMP
US initial jobless claims lifted again (see the chart below) and although claims are still at low levels they are trending up. Along with the recent lift in the unemployment rate, the decline in job advertisements and a slowing in average hourly earnings, this is a sign of a deceleration in the labour market which is an argument for the Fed to keep interest rates on hold in June.
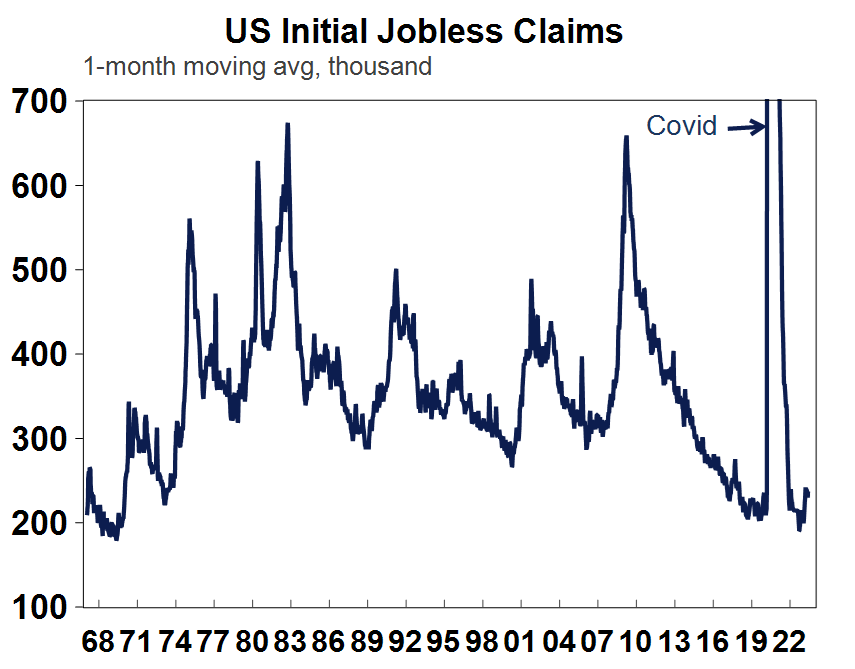
Source: Macrobond, AMP
The Chinese Caixin services index improved in May, rising from 56.4 to 57.1 despite the official services PMI weakening over the same period. The two indices are constructed differently, with the official measure a better gauge of larger firms and the Caixin a better guide to smaller firms. Chinese trade data was weak, with exports down by 7.5% over the year to May and imports down by 4.5%. May consumer price inflation was very low, at just 0.2% over the year (clearly there is no inflation problem in China – see the chart below) and producer prices continue to be deflation, down by 4.6% over the year to May.
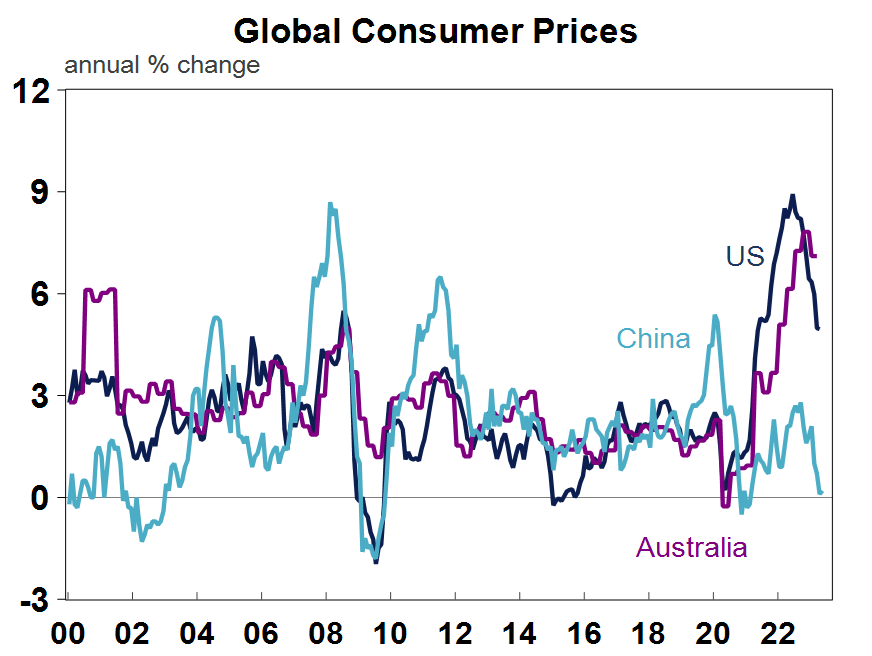
Source: Macrobond, AMP
The Bank of Canada surprised markets with a 0.25% rate increase, taking interest rates to 4.75%, a 22-year high. While the central bank had indicated in March that a pause to interest rates was likely, this was short-lived given “stubbornly high” inflation, a resilient economy, a tight labour market and a rebound in the housing market – a situation many developed economies are facing and means that another 1-2 interest rate hikes are likely in coming months.
Australian economic events and implications
The Reserve Bank of Australia lifted interest rates by 0.25% at its June meeting, taking the cash rate from 3.85% to 4.1% which we expected after last week’s decision on minimum wages by the Fair Work Decision but surprised financial markets and consensus estimates. The RBA’s decision to lift interest rates was due to the “upside risks to inflation”, with the recent tick up in monthly inflation (with the latest data available to April), higher risk of a wages breakout because of the influencing impact of the recent Fair Work Commission’s decision around minimum wages which awarded a 5.7% increase to minimum award wages and 8.65% to minimum wages (which is around a quarter of the workforce), lift in public sector wages, sticky inflation globally which could be a leading indicator for Australian inflation, the tick up in home prices and Australia’s low productivity growth (which was down by 4.5% over the year to March) which lifts unit labour costs.
The 4% increase in interest rates since May last year means it is becoming much harder for the economy to remain on an “even keel” as the RBA and most are forecasting and runs the real risk of tipping the economy into a recession, which we assign a 50% risk to in the next 12 months. There are already increasing signs that the economy is weakening – retail sales has slowed, the unemployment rate is rising, building construction is collapsing, and this is all occurring at a time that the inflation indicators are pointing down. We don’t think it is necessary to induce a recession to Australia to see the inflation outcomes the RBA would like. But it looks like the RBA has grown more impatient in waiting for inflation to slow and has given up on the argument about the lagged impact of interest rate hikes (which was an argument used to keep the cash rate steady at the April meeting). It also looks like the RBA is increasingly of the view that it needs to bring the cash rate more in line with its global peers (after it previously appeared like the RBA was more comfortable with interest rates being lower in Australia compared to its global peers) – see the chart below.
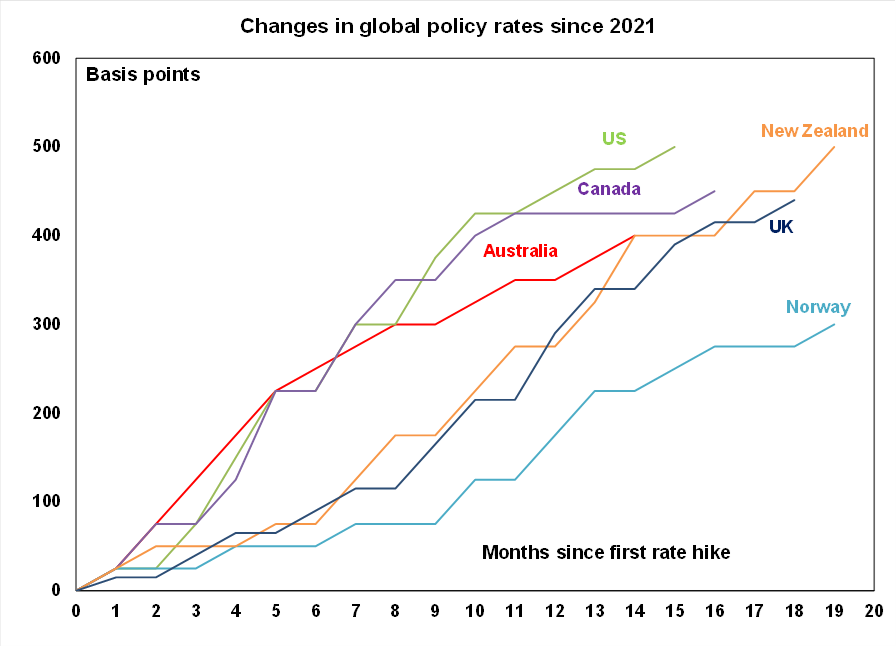
Source: Bloomberg, AMP
As a result of the RBA’s hawkishness, we are now allowing for another 0.25% rate hike in July and September, with the risk that the cash rate could get to ~5%, close to interest rates across some of our peers. Of course, the data could slow significantly over coming months which would see the RBA soften its stance on rate rises. Governor Lowe made a speech at the Morgan Stanley Australia Summit and sounded hawkish and there were no comments around the June decision being “finely balanced” (like it has been in previous meetings). Lowe mentioned the need to watch these key indicators to shape the RBA’s decision in July: developments in the global economy, trends in household spending, the outlook for inflation and the labour market.
Further rate rises means that GDP growth will weaken and we have downgraded our growth forecasts for 2023/24 with GDP growth sub 1% over the year in both December 2023 and March 2024. The Australian yield curve as measured by 2 year/10 year spread inverted over the past week (with the cash rate/10 year yield already having inverted) which could be the sign that markets are also starting to price in a higher risk of an Australian recession.
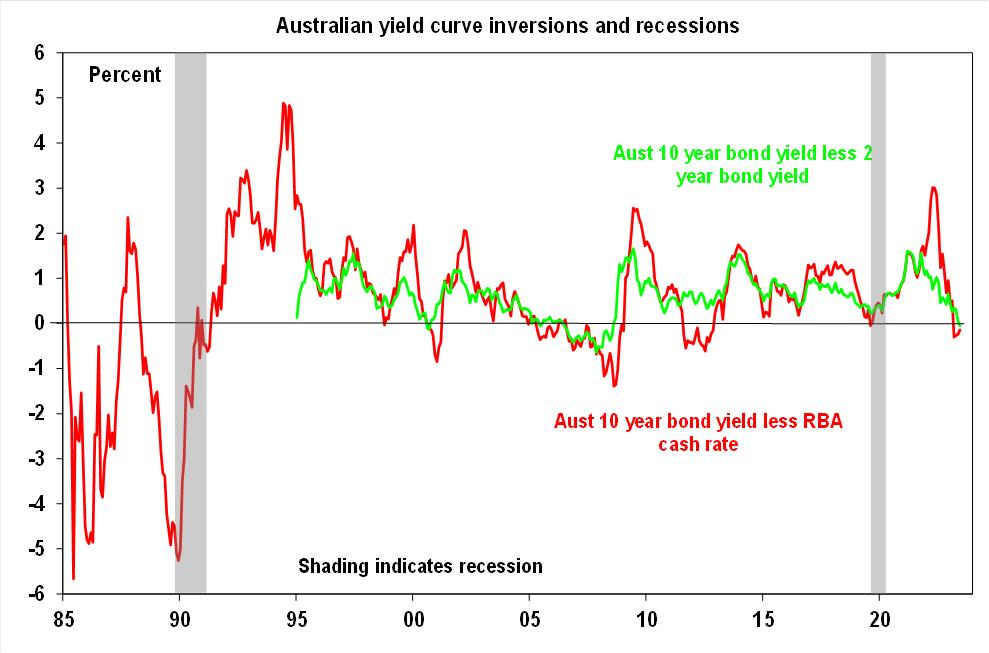
Source: Bloomberg, AMP
March quarter GDP growth slightly disappointed market expectations, and was up by 0.2% over the quarter or 2.3% over the year as household spending growth was low (with discretionary spending falling), residential construction declining, business investment up, public spending making a small contribution, inventories flat and net exports detracting from growth. Productivity growth was down by 4.5% over the year, its lowest on record (see the chart below).
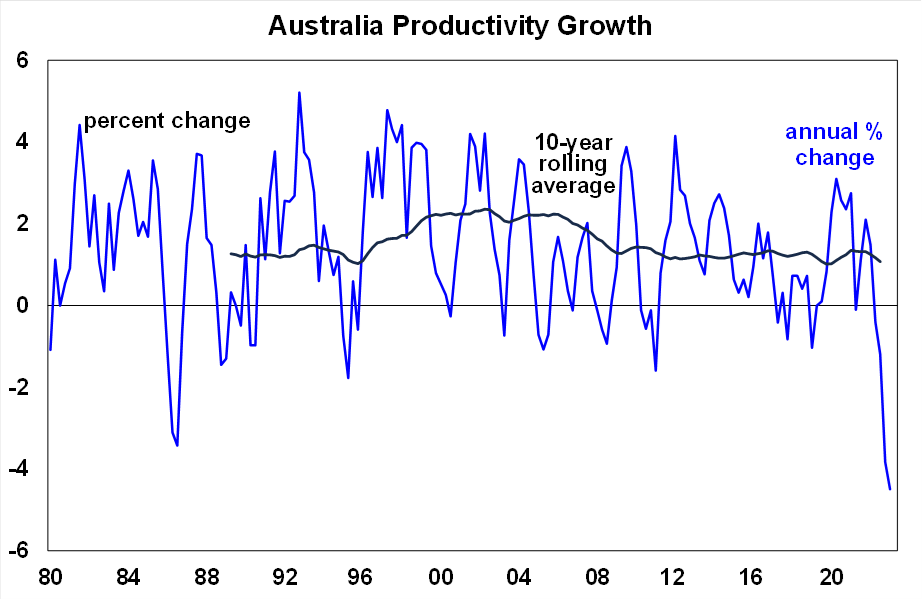
Source: ABS, AMP
The Melbourne Institute monthly inflation gauge was up by 5.9% year on year in May, a slowing from last month and is a leading indicator for the monthly consumer price figures (see the chart below).
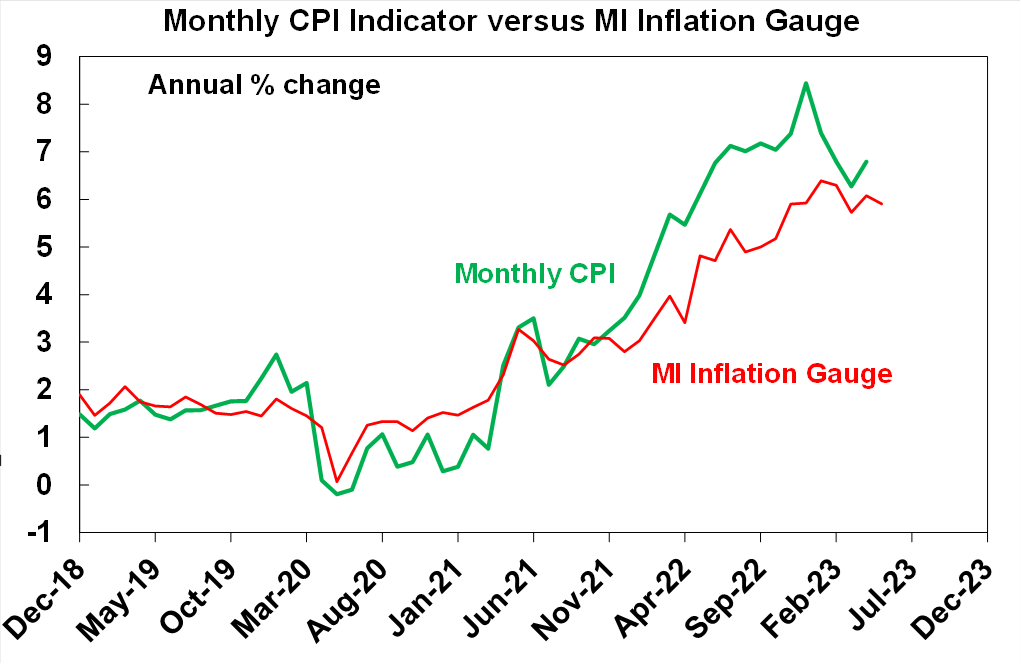
Source: ABS, Bloomberg, AMP
The Australian trade data showed a slight deterioration in the April trade balance (down to $13.7bn from $14.8bn last month) as export growth was down and imports were up.
What to watch over the next week?
The US May consumer price index is expected to be up by just 0.2% or 4.2% higher over the year (down from 4.9% last month) with core inflation up by a stronger 0.4% or 5.3% over the year. The Federal Reserve meets next week after the CPI data is released and it could be the key factor behind the decision to either hold the fed funds rate at 5-5.25% or hike by another 0.25%. Given recent weakness in some economic data, the Fed is expected to keep rates unchanged but the risk of another hike is high given that FOMC committee members have been hawkish in recent commentary. Other economic indicators to watch next week are the NFIB small business confidence index (released tonight), producer price inflation (which is expected to fall by 0.1% over the month and be up by 1.5% over the year – a good sign for consumer inflation), May retail sales (expected to be flat) and the University of Michigan consumer sentiment figures which will give an update on confidence and inflation expectations.
The European Central Bank meet next week and another 0.25% hike is expected, taking interest rates from 3.75% to 4%. April industrial production and March quarter wages growth is also released.
In China there is industrial production, retail sales (expected to be softer), fixed asset investment and the jobless rate.
The Bank of Japan meet next week but are not expected to many any policy changes to interest rates or the yield target.
New Zealand data includes food prices which are a key input into inflation data, Q1 GDP (expected to be flat but after a negative December quarter the risk of a technical recession is very high) and the May business PMI.
For Australia, the June Westpac/Melbourne Institute consumer sentiment data is likely to show a fall after the June interest rate decision, the NAB business survey for May is likely to show a deterioration in business confidence, the May employment figures are expected to show a 15K lift in jobs after the fall in the prior month which would keep the unemployment rate unchanged at 3.7% and the June Melbourne Institute consumer inflation expectations will also indicate whether inflation expectations are rising.
Outlook for investment markets
The next 12 months are likely to see easing inflation pressures and central banks moving to get off the brakes. This along with improved valuations should make for reasonable share market returns. But the next few months are likely to be rough given high recession and earnings risks, uncertainty around US banks, the potential of unexpected rate rises and poor seasonality out to around September/October. This is likely to impact both global and Australian shares.
Bonds are likely to provide returns above running yields, as growth and inflation slow and central banks become less hawkish.
Unlisted commercial property and infrastructure are expected to see slower returns, reflecting the lagged impact of last year’s rise in bond yields on valuations. Commercial property returns are likely to be negative as “work from home” hits space demand as leases expire.
With an increasing supply shortfall, we have revised up our national average home price forecast for this year from a fall of -7% to around flat to up slightly ahead of 5% growth next year. However, the risk is high of a further leg down putting us back on track for a 15-20% top to bottom fall on the back of the impact of high and still rising interest rates and higher unemployment.
Cash and bank deposits are expected to provide returns of around 3.5%, reflecting the back up in interest rates.
The $A is at risk of more downside in the short term, but a rising trend is likely over the next 12 months, reflecting a downtrend in the overvalued $US and the Fed moving to cut rates.
What you need to know
While every care has been taken in the preparation of this article, neither National Mutual Funds Management Ltd (ABN 32 006 787 720, AFSL 234652) (NMFM), AMP Limited ABN 49 079 354 519 nor any other member of the AMP Group (AMP) makes any representations or warranties as to the accuracy or completeness of any statement in it including, without limitation, any forecasts. Past performance is not a reliable indicator of future performance. This document has been prepared for the purpose of providing general information, without taking account of any particular investor’s objectives, financial situation or needs. An investor should, before making any investment decisions, consider the appropriateness of the information in this document, and seek professional advice, having regard to the investor’s objectives, financial situation and needs. This article is solely for the use of the party to whom it is provided and must not be provided to any other person or entity without the express written consent AMP. This article is not intended for distribution or use in any jurisdiction where it would be contrary to applicable laws, regulations or directives and does not constitute a recommendation, offer, solicitation or invitation to invest.
The information on this page was current on the date the page was published. For up-to-date information, we refer you to the relevant product disclosure statement, target market determination and product updates available at amp.com.au.


